Bargeld bewegt sich auf den Märkten in vorhersehbaren Mustern, und die Geldpolitik der Zentralbanken ist allein dafür verantwortlich, dass Bargeld entweder in bestimmte Vermögenswerte fließt oder aus ihnen verschwindet.
Die Geldpolitik der Zentralbank ist der wichtigste Treiber der Märkte
Nur ein Beispiel: nach dem Zusammenbruch des Aktienmarktes/der Finanzkrise von 2008 führte die Federal Reserve das ein, was als quantitative Lockerung bekannt geworden ist. Quantitative Lockerung ist definiert als: „die Einführung von neuem Geld in die Geldmenge durch eine Zentralbank“. Dieses QE-Verfahren umfasst den WELTWEITEN Ankauf von Schuldtiteln durch eine Zentralbank UND die massive Emission von Schuldtiteln. Die Währung selbst ist eine Einheit von Schuldtiteln.
Quantitative Easing setzt einen Drehtürmechanismus in Gang, bei dem eine Zentralbank über eine Tür Schulden ausgibt und sie dann über eine andere Tür zurückkauft. Im Kern ermöglicht QE einer Zentralbank eine enorme Aufblähung der Gesamtverschuldung, was natürlich ihr übergeordnetes Ziel ist. Je mehr Schulden eine Zentralbank ausgibt, desto stärker wird sie.
Die quantitative Lockerung ist für das Aufblähen von Aktienmarkt- und Immobilienblasen verantwortlich. QE ist auch für die Entstehung inverser Blasen verantwortlich. Wenn eine Zentralbank QE einleitet, wird Bargeld aus anderen Anlageklassen, insbesondere Rohstoffen, abgezogen, was zu einer enormen Unterbewertung dieser Vermögenswerte führt. Diese Unterbewertung von Vermögenswerten schafft dann die Möglichkeit, Rohstoffe „IM VERKAUF“ oder mit einem enormen Abschlag zu kaufen.
QE drückt dann über diesen Mechanismus die Anleiherenditen künstlich nach unten, was wiederum den Weg für Bargeld in Risikopapiere/Aktien öffnet und somit Blasen an den Aktienmärkten aufbläst. QE führt zu einer Hyperinflation der Geldmenge bzw. der Gesamtverschuldung, was einen massiven Kaufkraftverlust zur Folge hat. Damit ist es nur eine Frage der Zeit, bis all diese zusätzlichen Scheine, in welcher Form auch immer sie existieren, ihren Weg durch das System finden. Das Ergebnis ist Inflation UND MASSIVE Preisverzerrungen über das gesamte Spektrum der Vermögenswerte.
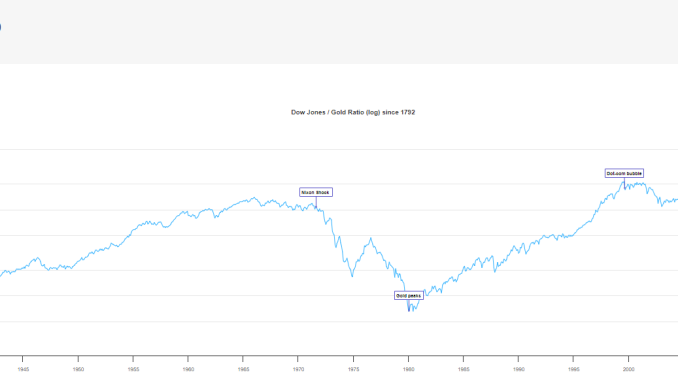
Da wir wissen, dass QE/Easy Money Policy/Suppressed Rates/Currency Devaluation, Bargeld entweder in oder aus bestimmten Vermögenswerten treiben, können wir Gold, oder genauer gesagt das DOW Gold Ratio, betrachten, um zu messen, wie extrem diese von den Zentralbanken verursachten Preisverzerrungen sind.
Unmittelbar vor dem Börsenkrach von 1929, der zur Großen Depression führte, erreichte das DOW-Gold-Verhältnis einen Höchststand von etwa 18 (was bedeutet, dass 18 Unzen Gold erforderlich waren, um den DOW zu erreichen). Während der Großen Depression fiel das Verhältnis DOW/Gold auf 1,59, d. h. es waren 1,59 Unzen Gold erforderlich, um den DOW zu erreichen. Im Jahr 1980 fiel das DOW/Gold-Verhältnis wieder auf 1,35. Kurz vor dem Dotcom-Börsencrash lag das DOW/Gold-Verhältnis bei 42! Nach dem Crash fiel es auf 6,7.
Heute liegt das DOW/Gold-Verhältnis bei etwa 17, was dem Wert kurz vor dem Börsenkrach von 1929 sehr nahe kommt.
Heute sind die Verzerrungen auf dem Markt extrem – noch nie in der Geschichte haben wir eine größere Hyperblase auf dem Schuldenmarkt erlebt. Daher werden wir meiner Meinung nach wieder einen erheblichen Rückgang des DOW-Gold-Verhältnisses erleben. Ich glaube sogar, dass wir ein Verhältnis von 1 zu 1 zwischen DOW und Gold sehen werden.
ORIGINALTEXT IN ENGLISCHER SPRACHE:
DOW/Gold Ratio and Stock Market Crashes.
Cash moves through the markets in predictable patterns, and central bank monetary policy is solely responsible for driving cash either into, or out of, certain assets.
Central bank monetary policy IS THE number one driver of the markets. Period.
As an example. After the stock market meltdown/financial crisis of 2008, the Federal Reserve implemented what has become known as quantitative easing. Quantitative easing is defined as: “the introduction of new money into the money supply by a central bank.” This QE process involves VAST purchases of debt by a central bank, AND MASSIVE ISSUANCE of debt, (the currency itself being units of debt).
Quantitative Easing initiates a revolving door mechanism by which a central banks issues debt via one door, and then buys it back through another. At its core, QE allows a central bank to vastly inflate the overall debt, which is of course their overall goal. The more debt a central bank issues, the stronger they become.
QE then via this mechanism artificially pushes bond yields lower, and this in turn opens a doorway for cash to make its way into risk assets/stocks, therefore inflating stock market bubbles. QE hyperinflates the money supply/overall debt, which is massively currency purchasing power negative. With that, it is only a matter of time before all those extra bills, in whatever form they exist, make their way through the system. The result is inflation, AND MASSIVE price action distortions across the entire spectrum of asset classes.
Quantitative easing is responsible for inflating stock market and real estate bubbles. QE is also responsible for creating inverse bubbles as well. When a central bank initiates QE, cash is pulled from other asset classes, more specifically commodities, resulting in enormous undervaluing of these assets. This undervaluing of assets then creates the opportunity to buy commodities “ON SALE,” or at a huge discount.
Understanding that QE/Easy Money Policy/Suppressed Rates/Currency Devaluation, drive cash either into or out of certain assets, we can look at gold, or more specifically the DOW Gold Ratio, to gauge how extreme these central bank induced price action distortions are.
Just prior to the stock market crash of 1929 which led to the Great Depression, the DOW/Gold ratio peaked at around 18 (meaning that it took 18 ounces of gold to equal the DOW). During the Great Depression, the DOW/Gold ratio fell to 1.59, meaning it took 1.59 ounces of gold to equal the DOW. In 1980, the DOW/Gold Ratio fell again to 1.35. Just prior to the Dotcom stock market crash, the DOW/Gold Ratio was 42! Which then after the crash dropped to 6.7.
Today, the DOW/Gold ratio sits at around 17, very close to where it was just prior to the 1929 stock market crash.
Today the distortions which exist in the market are at extreme levels, (never in history have we seen a larger debt market hyper-bubble). With that, and in my opinion, we will again see a DOW/Gold Ratio drop SUBSTANTIALLY. In fact, I believe that we will see a 1 to 1 DOW/Gold Ratio.


